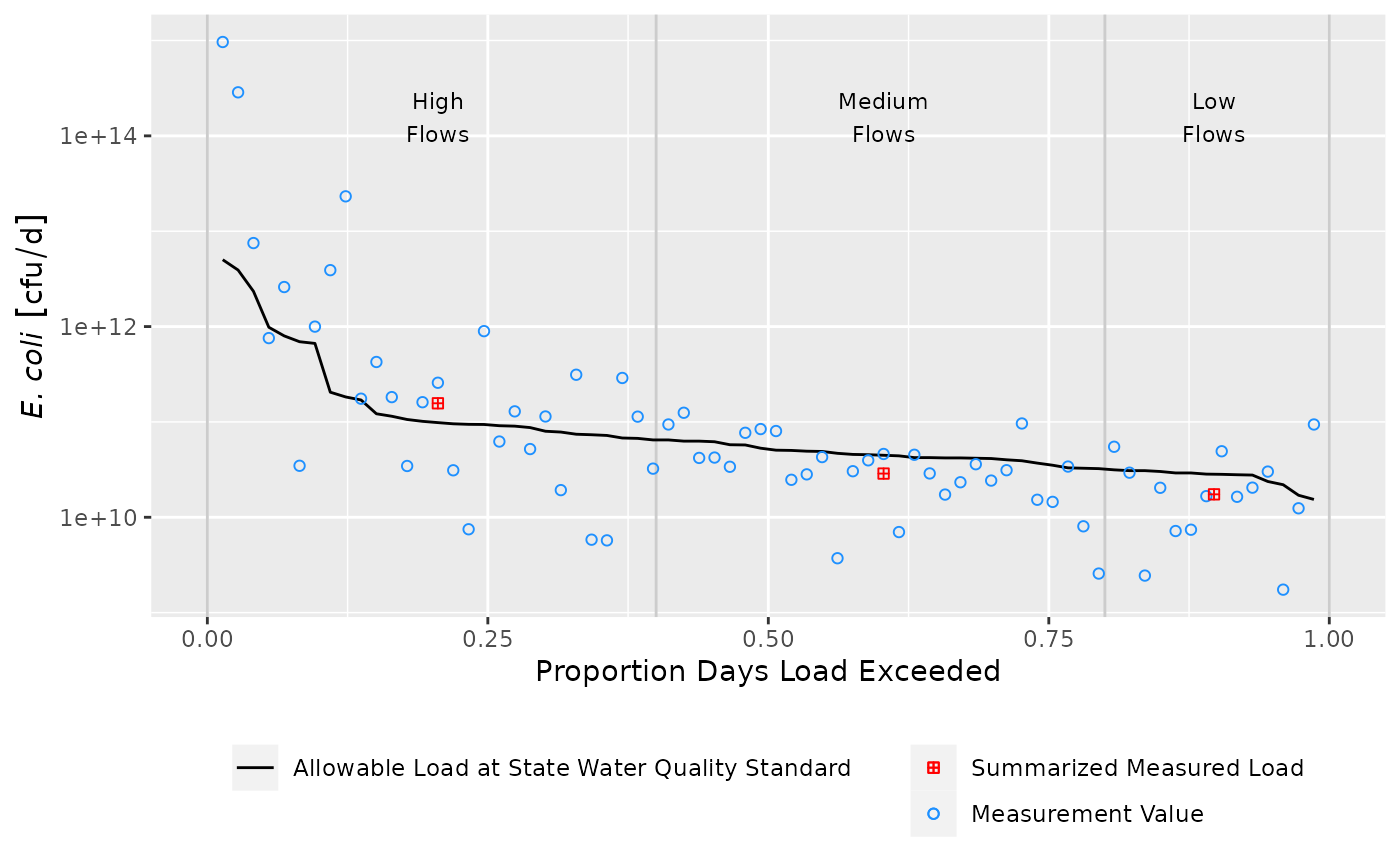
Creates a load duration curve visualization from the outputs of
calc_ldc and summ_ldc as a ggplot object.
Usage
draw_ldc(
  .tbl_calc,
  .tbl_summ,
  y_lab = NULL,
  ldc_legend_name = "Allowable Load at State Water Quality Standard",
  measurement_name = "Measurement Value",
  measurement_shape = 21,
  measurement_color = "dodgerblue",
  measurement_alpha = 1,
  summary_name = "Summarized Measured Load",
  summary_stat_shape = 12,
  summary_stat_color = "red",
  label_nudge_y = 0,
  label_font_family = "Arial",
  label_font_size = 3,
  label_break = TRUE
)
Arguments
- .tbl_calc
data frame object created by
calc_ldc- .tbl_summ
data frame object created by
summ_ldc- y_lab
optional string for y-axis label name, will be appended with units automatically. default is NULL.
- ldc_legend_name
string, provides the name used for the allowable pollutant load line in the legend. required.
- measurement_name
string, provides the name used for measured load values in the legend. required.
- measurement_shape
aesthetic value passed to the layer plotting measured load values. defaults to
21.- measurement_color
aesthetic value passed to the layer plotting measured load values. defaults to
"dodgerblue".- measurement_alpha
aesthetic value passed to the layer plotting measured load values. defaults to
1.- summary_name
string, provides the name used for summary statistic values in the legend. required.
- summary_stat_shape
aesthetic value passed to the layer plotting summary statistic values. defaults to
12.- summary_stat_color
aesthetic value passed to the layer plotting summary statistic values. defaults to
"red".- label_nudge_y
numeric value to vertically nudge flow category labels. If a log10 transformed scale is being used, a log value is probably appropriate for example
log10(1000).- label_font_family
string specifying font family to use in flow category labels.
- label_font_size
numeric value specifying font size to use in flow category labels.
- label_break
logical, add line breaks to flow category labels. Labels will break at spaces.
Examples
# Basic example using built in Tres Palacios data
library(dplyr)
library(units)
library(ggplot2)
# Format data
install_unit("cfu")
df <- as_tibble(tres_palacios) %>%
        ## filter data so this run quicker
        filter(!is.na(Indicator_Bacteria)) %>%
        ## flow must have units, here is is in cfs
        mutate(Flow = set_units(Flow, "ft^3/s")) %>%
        ## pollutant concentration must have units
        mutate(Indicator_Bacteria = set_units(Indicator_Bacteria, "cfu/100mL"))
# Calculate LDC

## specify the allowable concentration
allowable_concentration <- 126
## set the units
units(allowable_concentration) <- "cfu/100mL"
df_ldc <- calc_ldc(df,
                   Q = Flow,
                   C = Indicator_Bacteria,
                   allowable_concentration = allowable_concentration)

# Summarize LDC
df_sum <- summ_ldc(df_ldc,
                   Q = Flow,
                   C = Indicator_Bacteria,
                   Exceedance = P_Exceedance,
                   groups = Flow_Category,
                   method = "geomean")

# Create ggplot object
draw_ldc(df_ldc,
         df_sum,
         y_lab = expression(paste(italic("E. coli"))),
         label_nudge_y = log10(1000)) +
         scale_y_log10() +
         theme(legend.title = element_blank(),
               legend.direction = "vertical",
               legend.position = "bottom")


## cleanup
remove_unit("cfu")
## cleanup
remove_unit("cfu")